img not found!

Certificate in Administrative Reporting & Data Visualization

Certificate in Administrative Reporting & Data Visualization

₹6,500.00 ₹3,250.00

50% fee concession will end in

To train administrative professionals in creating accurate and impactful reports using data visualization tools for better decision-making.

Description

Course Name: Certificate in Administrative Reporting & Data Visualization

Global Occupational Skill Standard – GOSS ID: GOSS/AC/CARDV/V1

Eligibility: 10+2 (Higher Secondary) or Equivalent.

Duration: Three Months.

Objective: The Certificate in Administrative Reporting & Data Visualization course is designed to equip administrative professionals with the skills to create accurate, insightful, and visually appealing reports that support data-driven decision-making. The course covers data collection, analysis techniques, report writing, and the use of visualization tools such as Microsoft Excel, Power BI, Tableau, or Google Data Studio. 

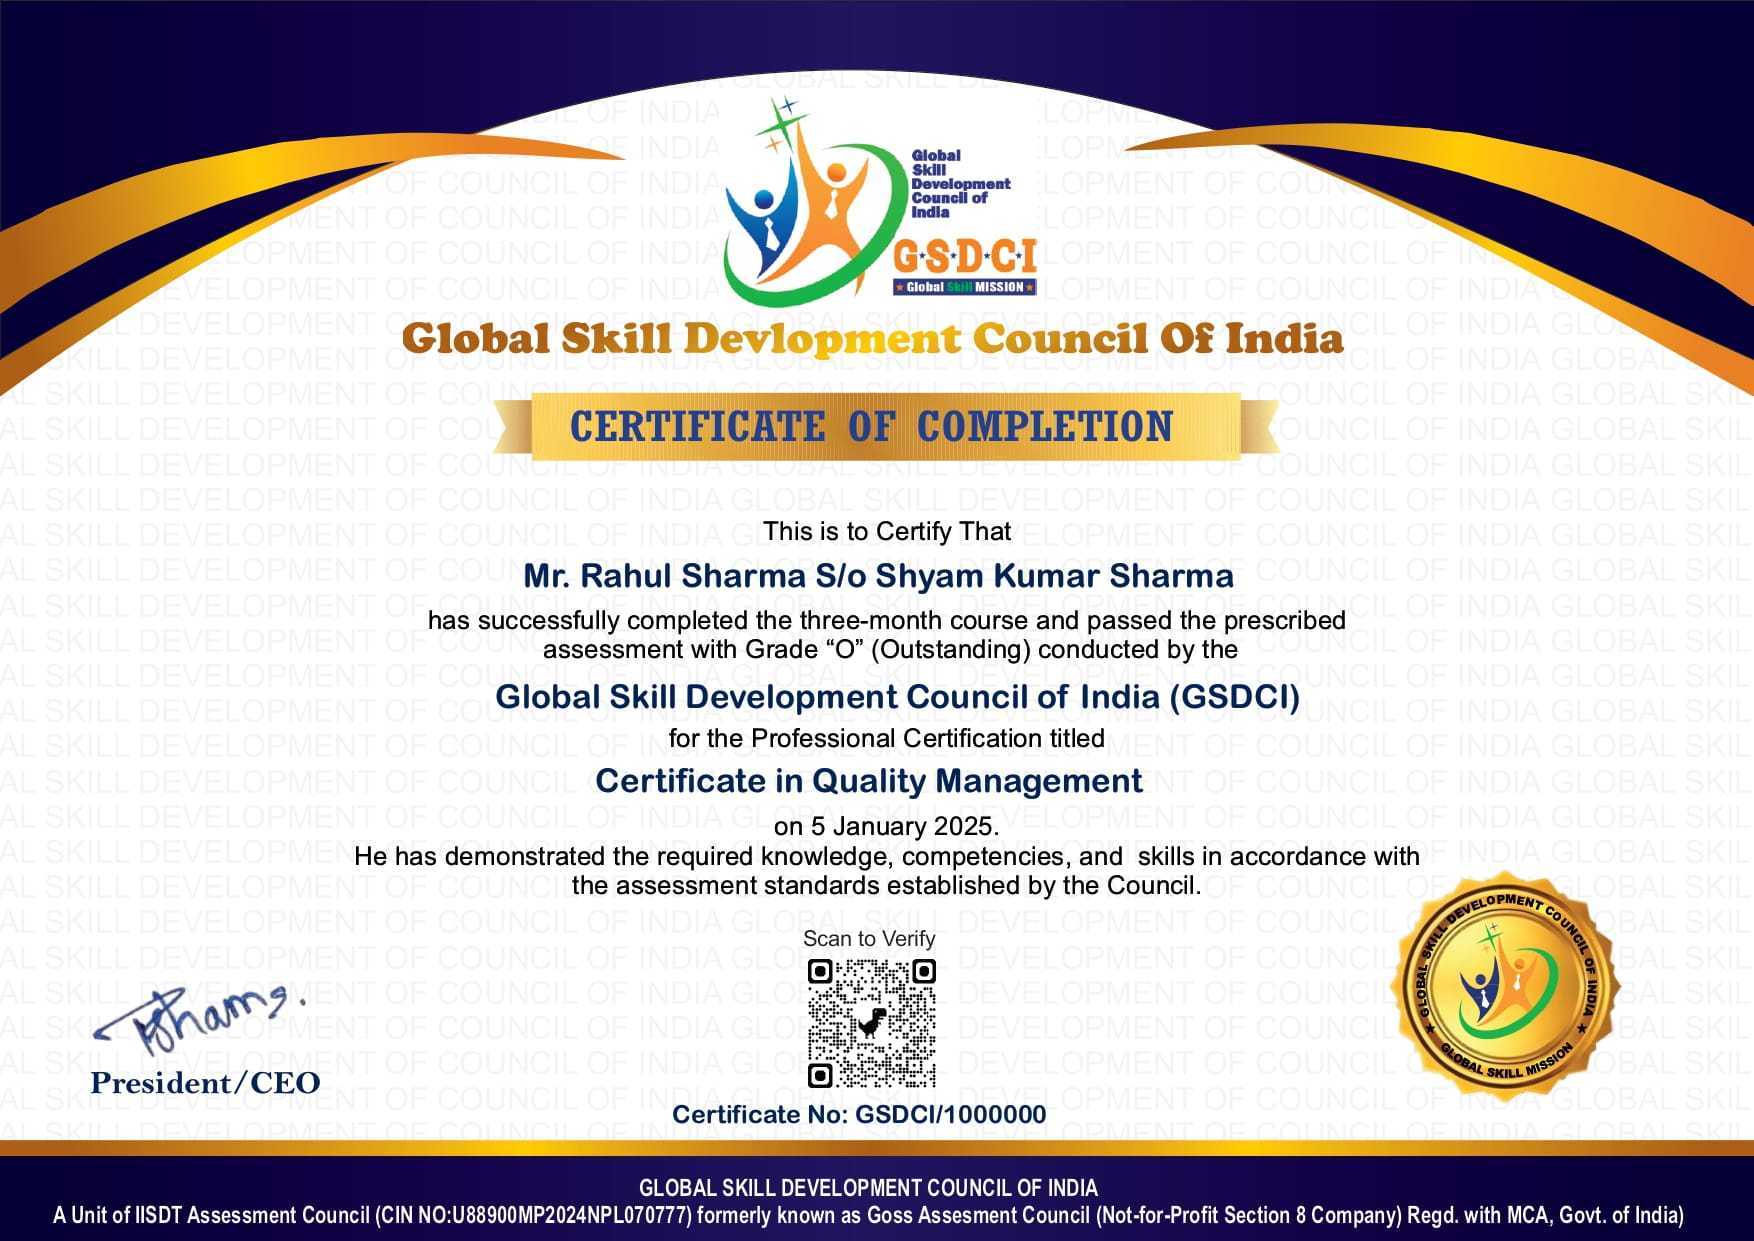
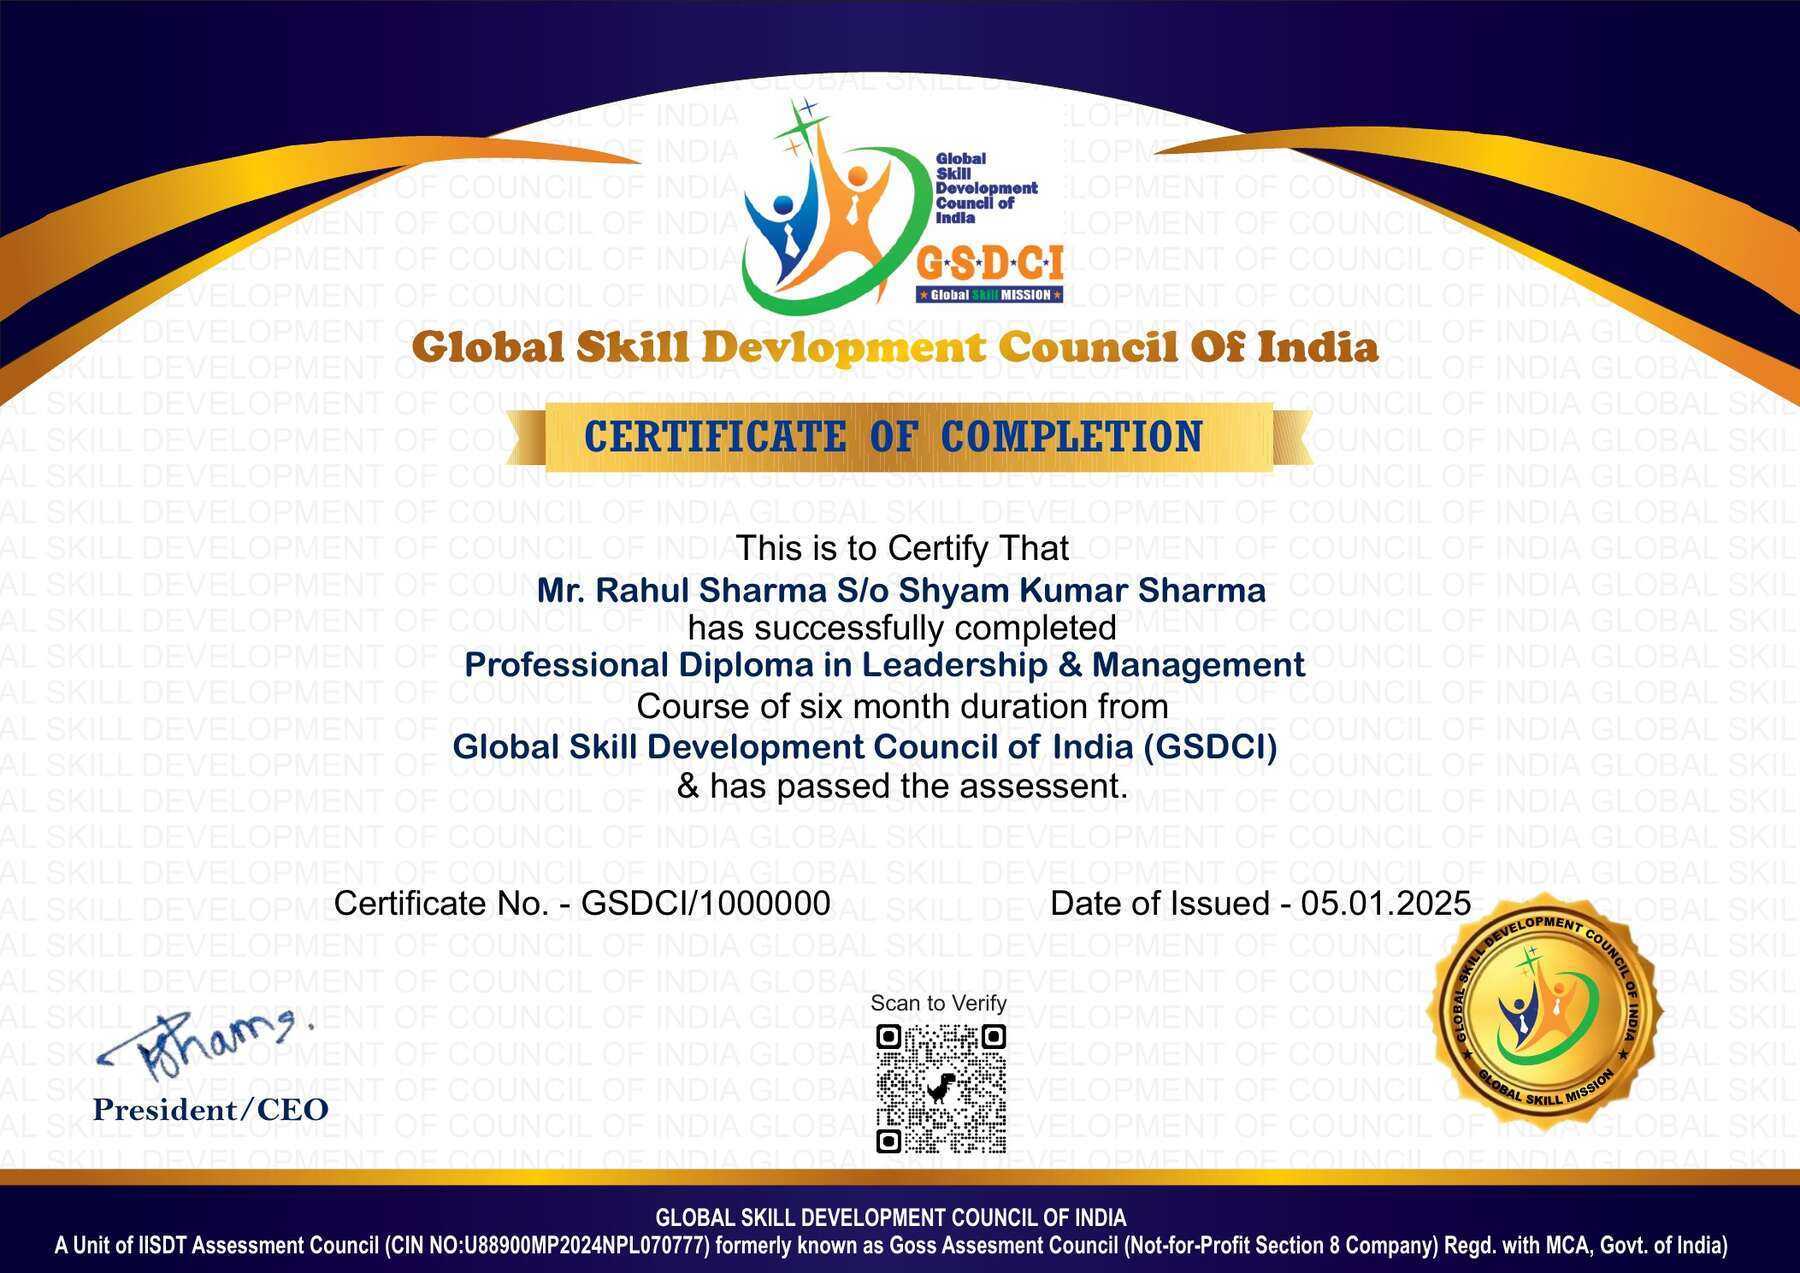
Get ready to join the Journey to become a GSDCI Certified Professional  – International Certification and Assessment Body.

Steps to become a GSDCI Certified Professional:

Step 1: Select your certification you want to pursue.

Step 2: Click on get certified tab, new pop up window will open.

Step 3: Click on pay certification fee, you will be redirected to billing details page.

Step 4: Fill your details and click on pay certification fee, You will be redirected to payment gateway, pay fee by any available options like Card(Debit/Credit), Wallet, Paytm, Net banking, UPI and Google pay.

Step 5: You will get Login Credentials of Online E-Books and Online assessment link on your email id, within 48 hrs of payment.

Step 6: After completion of the online assessment, the soft copy of your certificate will be sent to your registered email ID within 5 days.

Assessment Modules:

Module 1: Fundamentals of Reporting and Data Analysis: Introduction to Reporting in Administration, Types of Reports (Operational, Analytical, Strategic), Understanding Data Sources and Data Quality, Basics of Data Collection and Management, Key Performance Indicators (KPIs) and Metrics, Importance of Accuracy and Timeliness in Reporting.

Module 2: Data Visualization Principles: Introduction to Data Visualization, Principles of Effective Visualization, Choosing the Right Chart Types, Use of Colors and Labels, Avoiding Common Visualization Mistakes, Storytelling with Data.

Module 3: Tools for Reporting and Visualization: Overview of Reporting Software (Excel, Google Sheets, Power BI, Tableau), Using Dashboards for Real-Time Reporting, Introduction to Data Visualization Tools, Basic Automation in Reporting, Integrating Multiple Data Sources, Customizing Reports and Visuals.

Module 4: Creating Reports and Dashboards: Structuring Reports for Clarity and Impact, Designing Interactive Dashboards, Using Formulas and Functions in Reports, Embedding Visuals in Reports, Exporting and Sharing Reports, Maintaining Report Templates.

Module 5: Advanced Data Analysis Techniques: Data Filtering and Sorting, Pivot Tables and Charts, Trend Analysis and Forecasting, Using Conditional Formatting, Identifying Outliers and Anomalies, Data Validation and Error Checking.

Module 6: Presentation and Communication of Reports: Best Practices for Presenting Data, Tailoring Reports for Different Audiences, Explaining Complex Data Simply, Handling Questions and Feedback, Ethical Considerations in Data Reporting, Continuous Improvement and Skill Development.

GSDCI Online Assessment Detail:

  • Duration- 60 minutes.
  • Number of Questions- 30.
  • Number of Questions from each module: 5.
  • Language: English.
  • Exam Type: Multiple Choice Questions.
  • Maximum Marks- 100, Passing Marks- 50%.
  • There is no negative marking in any module.
Marking System:
S.No. No. of Questions Marks Each Question Total Marks
1 10 5 50
2 5 4 20
3 5 3 15
4 5 2 10
5 5 1 5
30   100
How Students will be Graded:
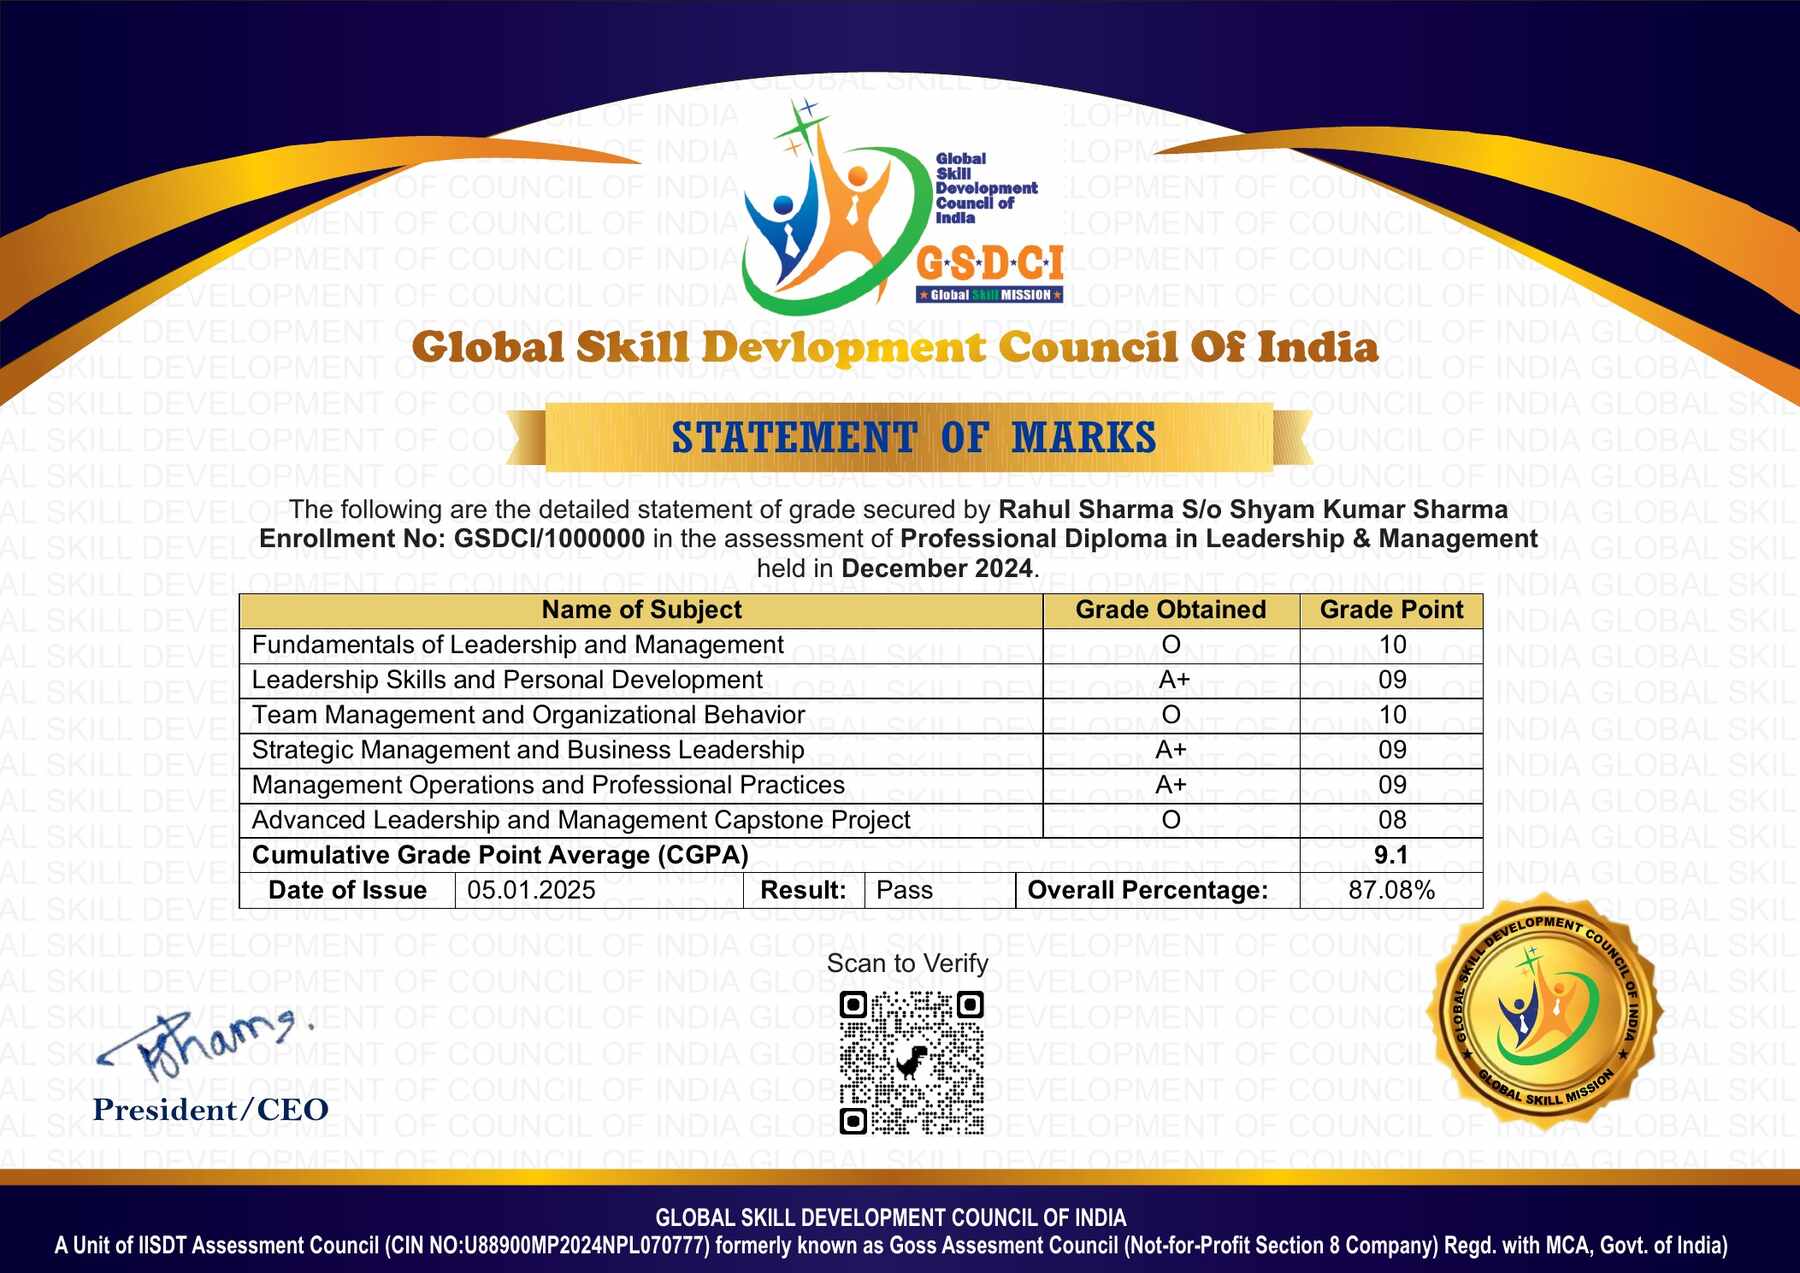
S.No. Marks Grade
1 91-100 O (Outstanding)
2 81-90 A+ (Excellent)
3 71-80 A (Very Good)
4 61-70 B (Good)
5 50-60 P (Pass)
6  0-49 F (Fail)


Benefits of Certification:

1. Global Recognition & Credibility – Stand out worldwide with a certification that strengthens your professional profile across borders and demonstrates your skills to employers and institutions.

2. Quality Assurance through ISO Certification – Programs follow an ISO-certified quality management system to promote consistency, reliability, and a standardized learning experience.

3. Career Advancement & Employability – Enhance your résumé, demonstrate professional competence, and improve your prospects for career growth, promotions, or suitable job opportunities.

4. Non-Profit Trust Factor – Certification from a non-profit organization reflects a mission-driven approach focused on skill development, professional learning, and public benefit.

5. Access to Learning Resources – Gain access to useful learning resources such as e-books, mock tests, assessments, and online academic support.

6. Transparency & Online Verification – Each certification includes a unique enrolment or certificate ID, enabling convenient online verification by employers and other interested parties.

7. Lifetime or Long-Term Validity – Certifications may offer lifetime or extended validity, reducing the need for frequent renewal, subject to the applicable certification scheme.

Course Rating

5.0/5
★★★★★
★★★★★

Based on 54 student ratings

Highly Rated Course

Reviews

There are no reviews yet.

Be the first to review “Certificate in Administrative Reporting & Data Visualization”

Your email address will not be published. Required fields are marked *

A 50% fee concession is applicable on all certification up to 22nd October 2026.

0
    0
    Your Certification Detail
    Your cart is emptyReturn to Shop